DyadWaves version 0.2.0.1
Documentation
Download
Table of Contents
1 Overview
DyadWaves is an easy to use GUI for 1D and 2D Wavelet Transform. This software is pretty basic with functionality consisting of Wavelet Transform computation, signal/image approximation and denoising using up to three transform modes. It uses separate executables for 1D and 2D processing that are appropriately labeled. This software is build using C++ and Nokia’s QT4(http://qt.nokia.com/). 1D Dyadwaves graphs are build using QWT library courtesy of Qwt project (http://qwt.sf.net). FFT computations are done using FFTW3 library (http://www.fftw.org/).
1.1 Transform Modes
There are three available modes.
- dwt_sym - Decimated Discrete Wavelet Transform using symmetric extension.
- dwt_per - Decimated Discrete Wavelet Transform using periodic extension.
- Stationary (Undecimated) Wavelet Transform. It also uses peiodic extension.
1.2 Wavelet Families
Four wavelet families are currently available.
- Daubechies- 15 orthogonal wavelets are available, ranging from 2-tap filters to 30-tap filters.
- Biorthogonal - Symmetric filter non-orthogonal wavelets. bior1.1 to bior6.8
- Coiflets - 5 wavelets. coif1 - coif5.
- Symmlets - 10 wavelets from sym1 to sym10.
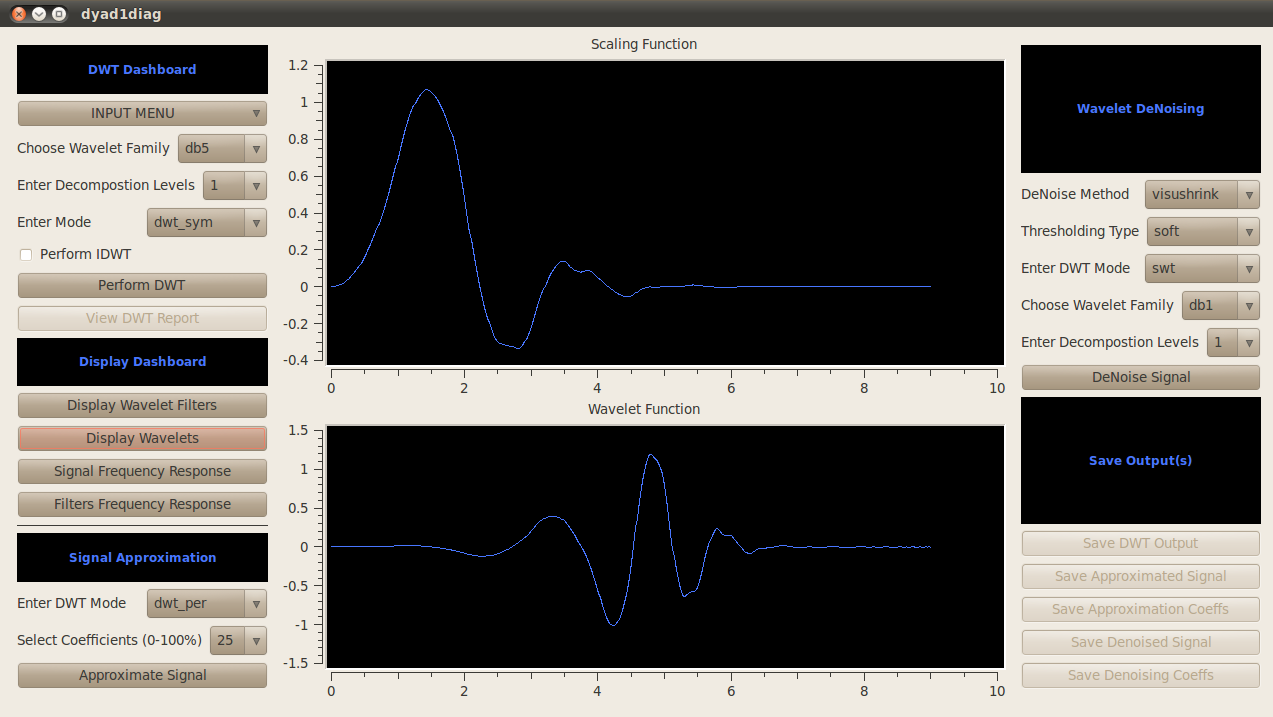
Wavelets, associated filters and filter frequency response can be plotted by selecting the wavelet from the "Choose Wavelet Family" dropdown box in the DWT Dashboard and then using appropriate pushbuttons in the Display Dashboard as shown below.
1.3 Input/Output
1D :: 1D I/O is very, very basic at this point. It accepts text/data files arranged in either one row or one column.To view the data format you may want to check the dyadwaves folder after running dyadwaves. Default signal is saved as defaultsignal.txt. You can save outputs (coefficients and processed signal) in the same 1D text/data format or you can save graphs as image/pdf/svg files.
2D :: Input is in the form of images ( tif,tiff,jpeg,bmp,png). Output images can be saved in these same five formats. Two more formats are added - xbm and xpm for X11 systems.
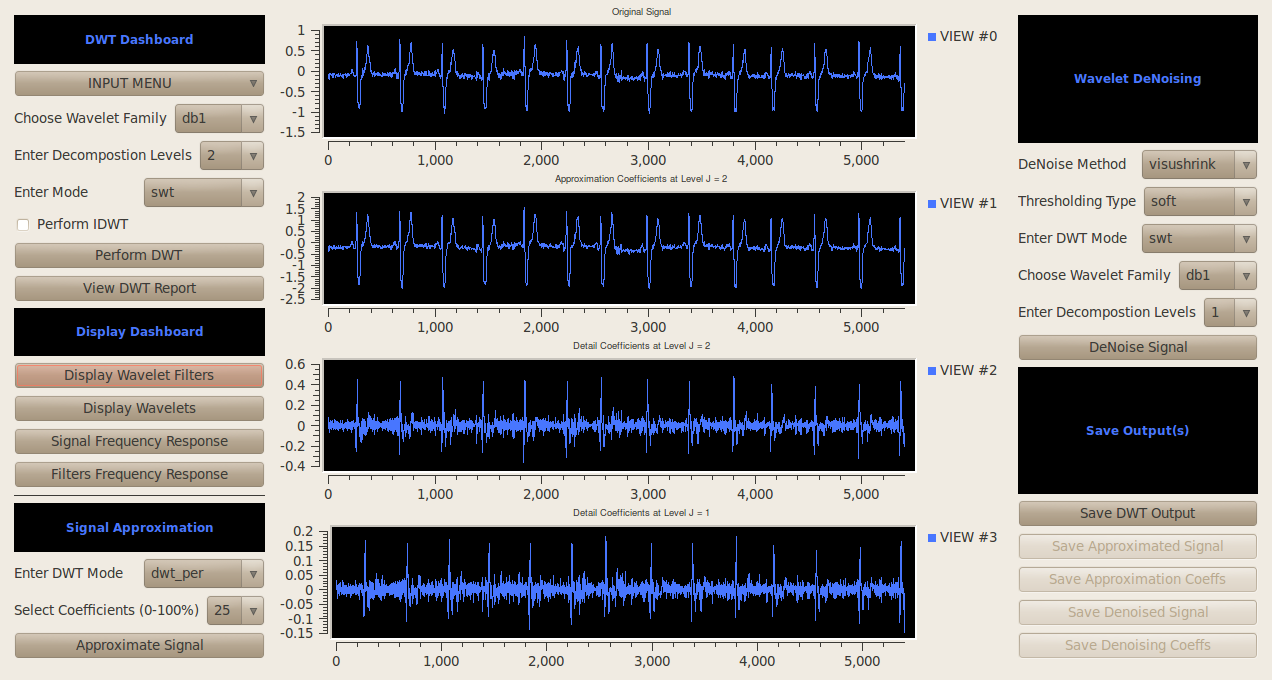
1.4 1D Interface
1D Interface displays input and output graphs. These graphs can be zoomed in and zoomed out. IDWT graphs have additional options of saving and viewing each graph separately as the display view can get very busy if decomposition levels are large specially if screen resolution isn’t very high.
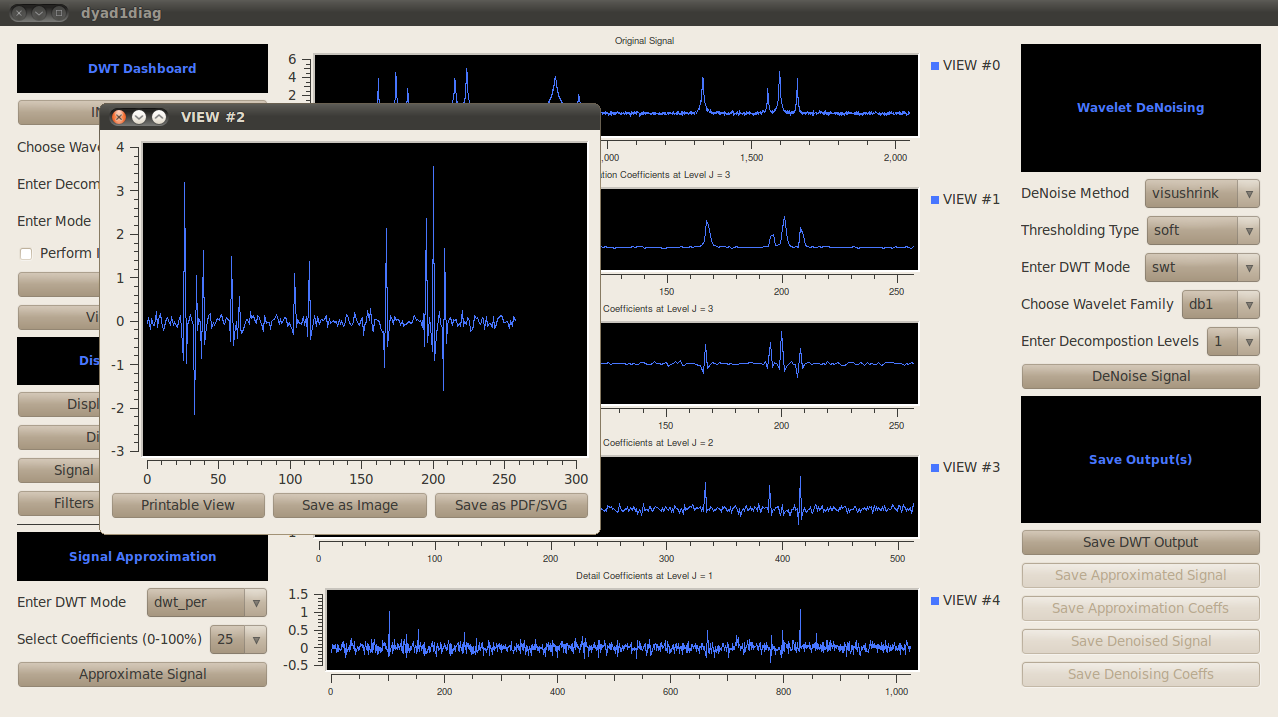
Graphs can also be viewed and saved in printer-friendly format(blue on white).
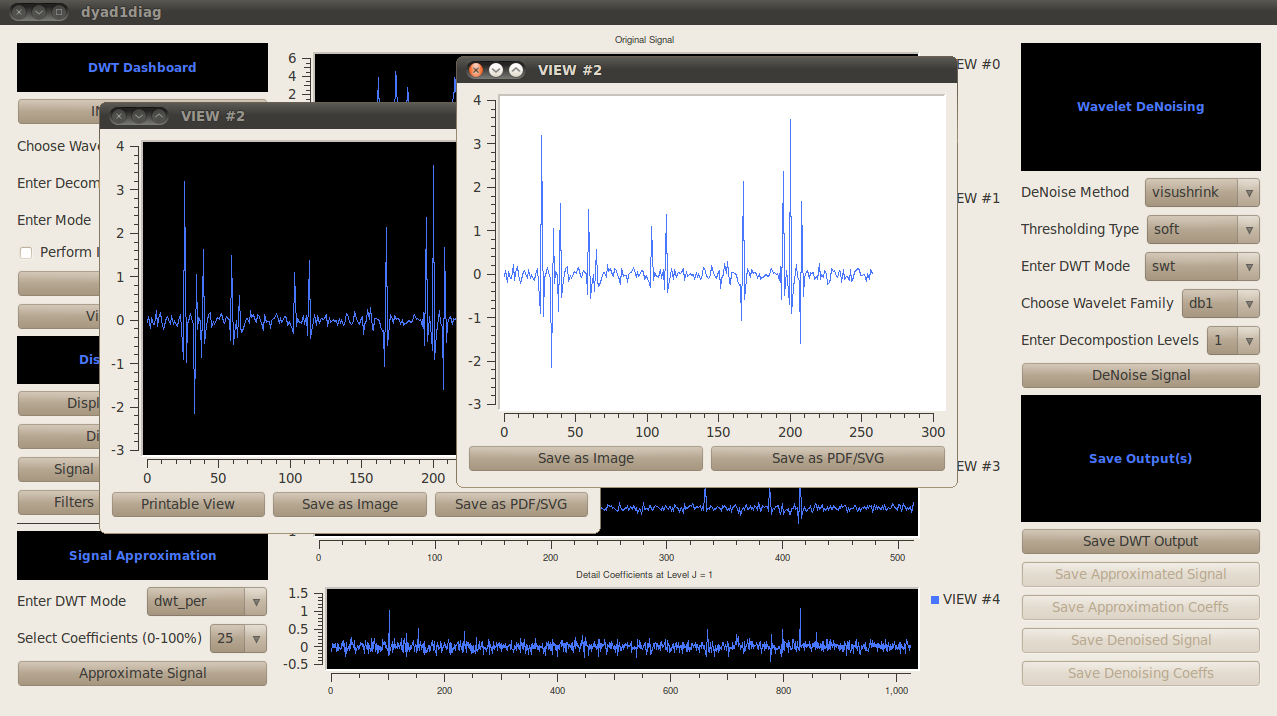
Please also note that "save as PDF/SVG" format will also save outputs in the five image format and uses rendering of the graph which in most cases result in better quality ouputs. "Save as Image" is the quick and dirty format and will capture the pixmap as is so the results may not be up to par on many occasions.
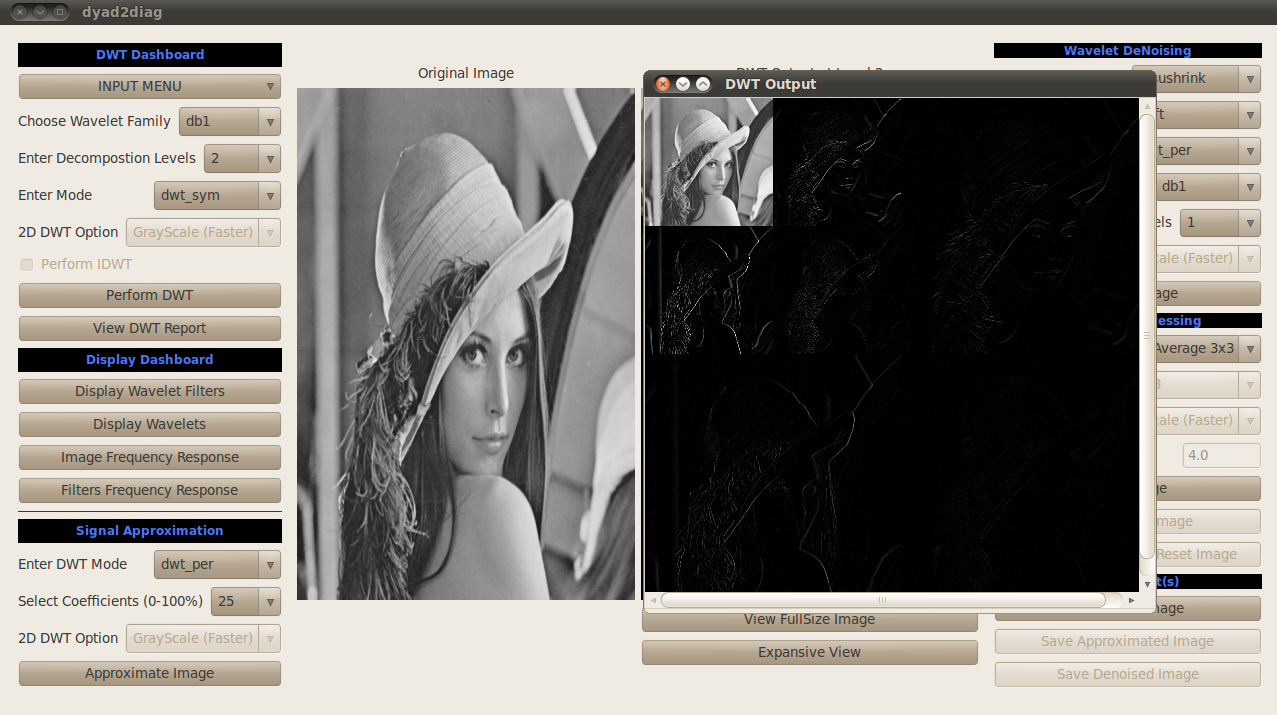
1.5 2D Interface
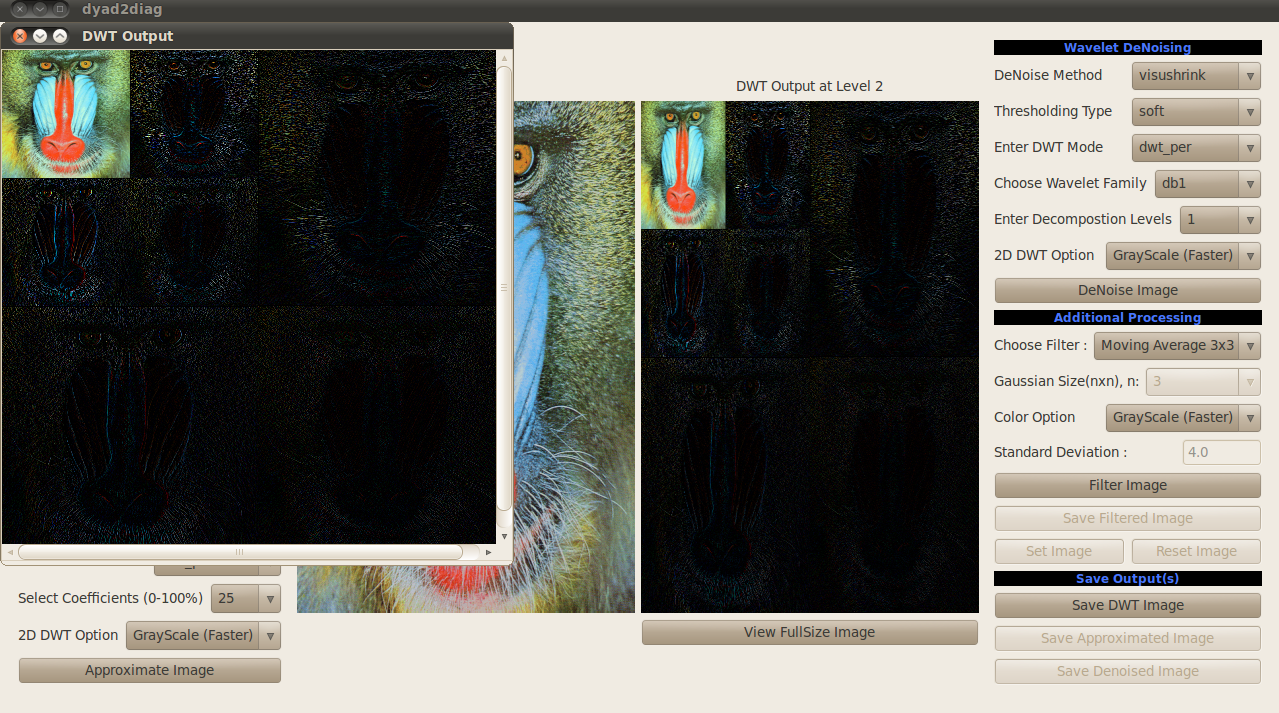
2D interface display is similar to the 1D case minus any zoom functionality. However, if the images are large they may not fit in the application window or they may not appear proportionally to their dimensions. In such a case, you have the option of viewing full size image. There is also an option of viewing all DWT coefficients. These are liberally zeropadded in order to have a rectangular image.
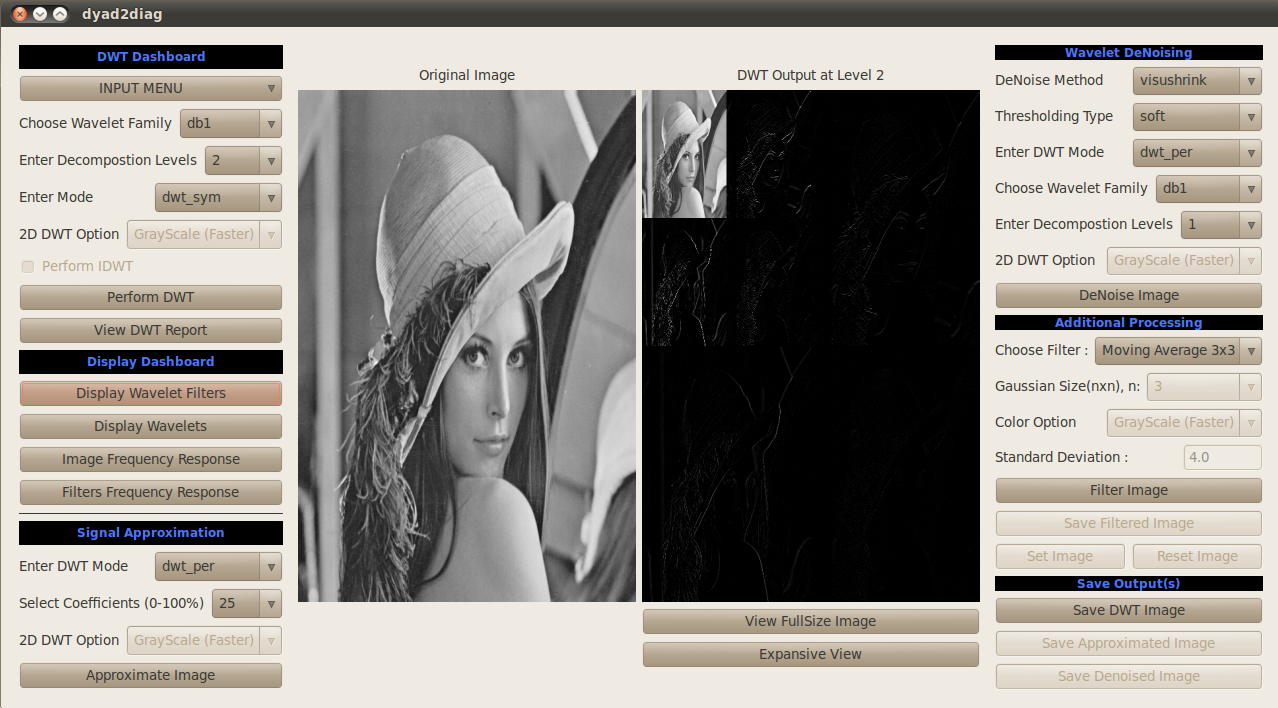
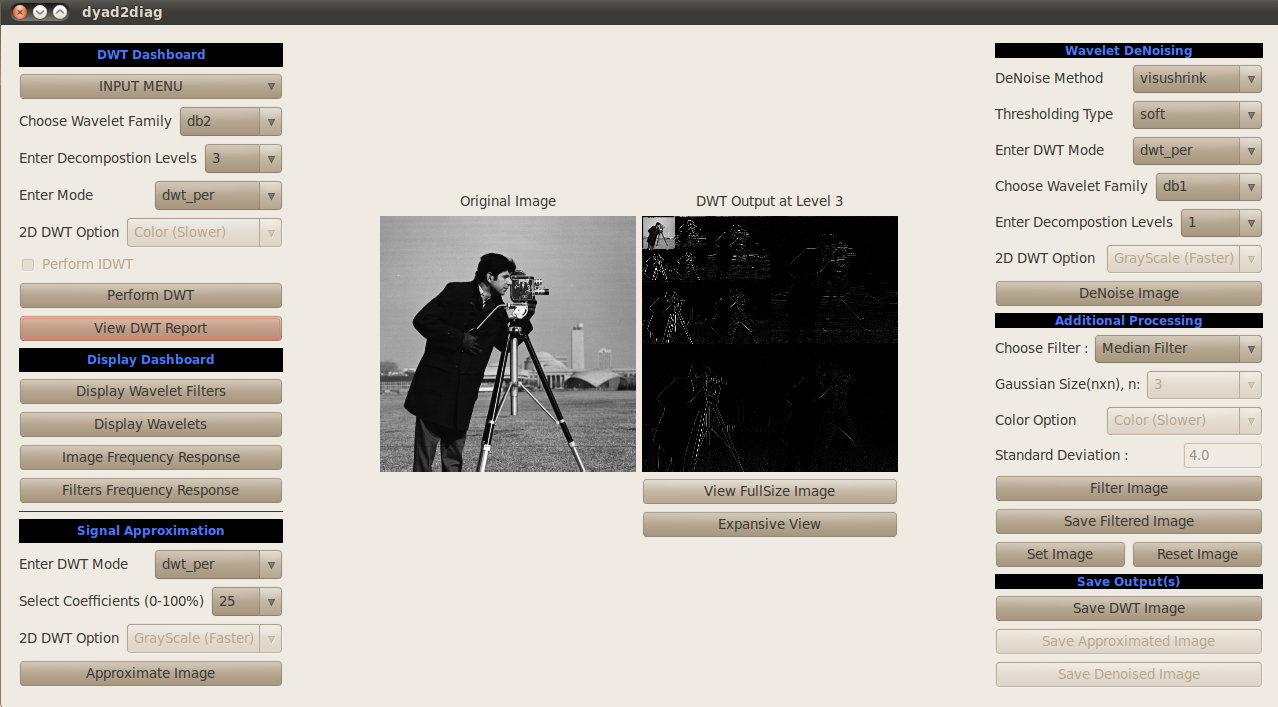
Full size Decomposition can be viewed using “View FullSize Image” button. “Expansive View” is available for grayscale images and it consists of displaying all coefficients with extensive zeropadding to keep the dimensions rectangular.
1.6 Changes from Previous (0.1.2.2) Version
A couple of major and several minor changes:
1. The Interface is slightly different. There are no Menu or Tool Bars. Menu can be accessed from the "INPUT MENU" button. This is done for aesthetics, performance and implementational reasons.
2. Denoising Bug that caused Image Denoising to crash for 1-scale color Denoising has been fixed.
3. Another Major fix involves getting rid of artifacts that were caused in approximated and denoised images because of QT4 using modulus of overflow RGB values instead of scaling them down.
4. 1D DyadWaves now accepts *.dat files as well as *.txt files. It will also save coefficients in these two formats. The output is still restricteded to being 1D row/column vector. I expect to add more options in future releases.
5. 2D DyadWaves2D loads/saves more image formats including X11 bitmap/pixmap formats.
6. Image FFT can now be saved in all available image formats.
2 Wavelet Transform
There are three wavelet transform modes - dwt_sym, swt and dwt_per. All of them have same display system and the DWT output can be saved as text file using the "Save DWT Output" button in the 1D mode and as image in 2D mode.
2.1 1D Decimated DWT (Symmetric Extension)
Of all the modes , this one is the best equipped to deal with signal boundary issues and gives excellent results for symmetric and nearly symmetric wavelets. Signal is symmetrically extended at every stage so there are no sharp jumps and discontinuities. On the negative side, there is some redundancy in the system as this isn’t an N input N output system.
2.2 1D Stationary Wavelet Transform (Undecimated)
For 1D case, an N input signal yields 2XN output coefficients at each stage. There is more redundancy but it is useful in cases where translation-invariance is needed. This software also uses SWT (alongside the other two modes) for denoising.
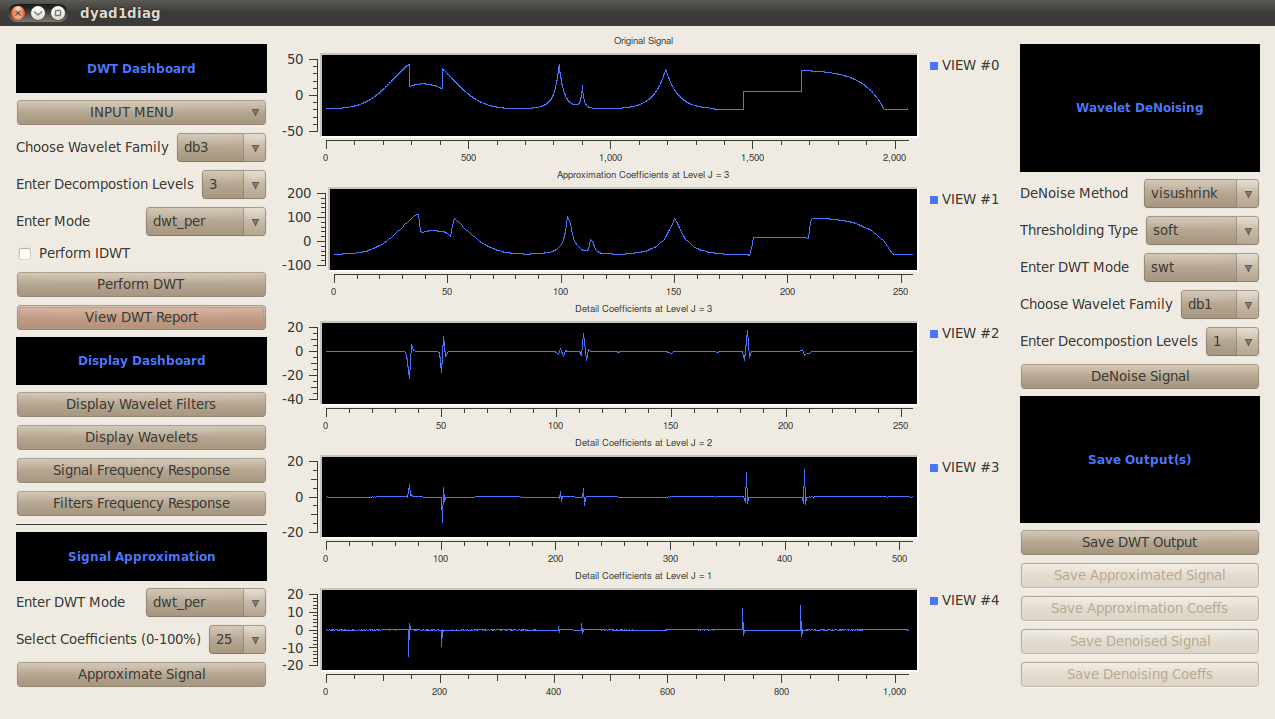
2.3 1D Decimated DWT (Periodic Extension)
dwt_per mode is a N input and ~N output system and ,thus, often is the fastest scheme of the three.Although, periodic extension may sometimes result in subpar performance at the signal boundaries. Regardless, having least redundancy makes it suitable for some approximation applications.
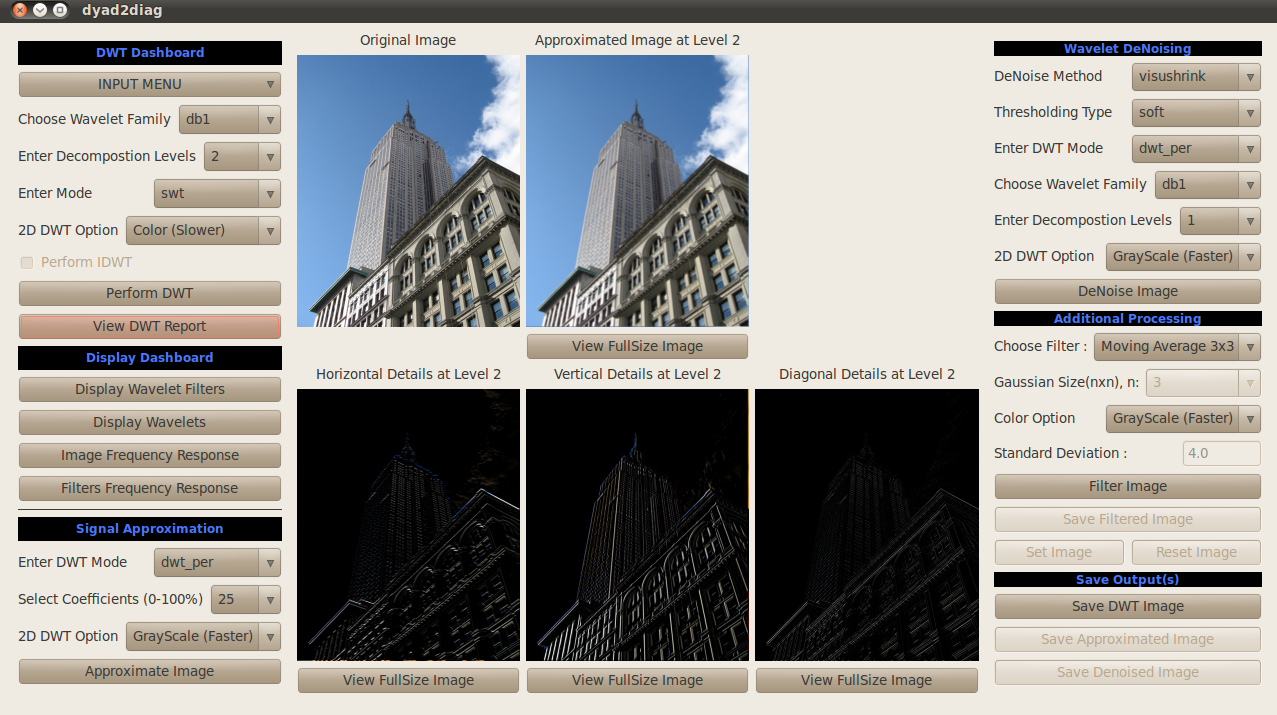
2.4 2D Decimated DWT (Symmetric Extension)
2D DWT is similar to 1D in terms of options with one exception - you have an option of faster processing a color image by treating it as a grayscale image. This is due to speed issues in this implementation. Smaller Images ( < 512 X 512) shouldn’t be too much of a nuisance on most systems.
2.5 2D Stationary Wavelet Transform (Undecimated)
Same goes for Stationary Wavelet Transform with the additional caution that speed is an even bigger of an issue for high number of decomposition levels( > 2 actually if color image is large in size).
2.6 2D Decimated DWT (Periodic Extension)
3 Approximation*
DyadWaves uses a very simple approximation algorithm. User can select the wavelet name from the DWT Dashboard, percent of non-zero coefficients and the wavelet mode(Either dwt_per or dwt_sym) from the Approximation Dropdown menu. Based on the percentage selected, the algorithm calculates the hard universal threshold and zeroes all coefficients that have values below that threshold. Inverse DWT is then computed to reconstruct the signal from the non-zero coefficients. dwt_per has fewer coefficients so it gives better results in most cases.
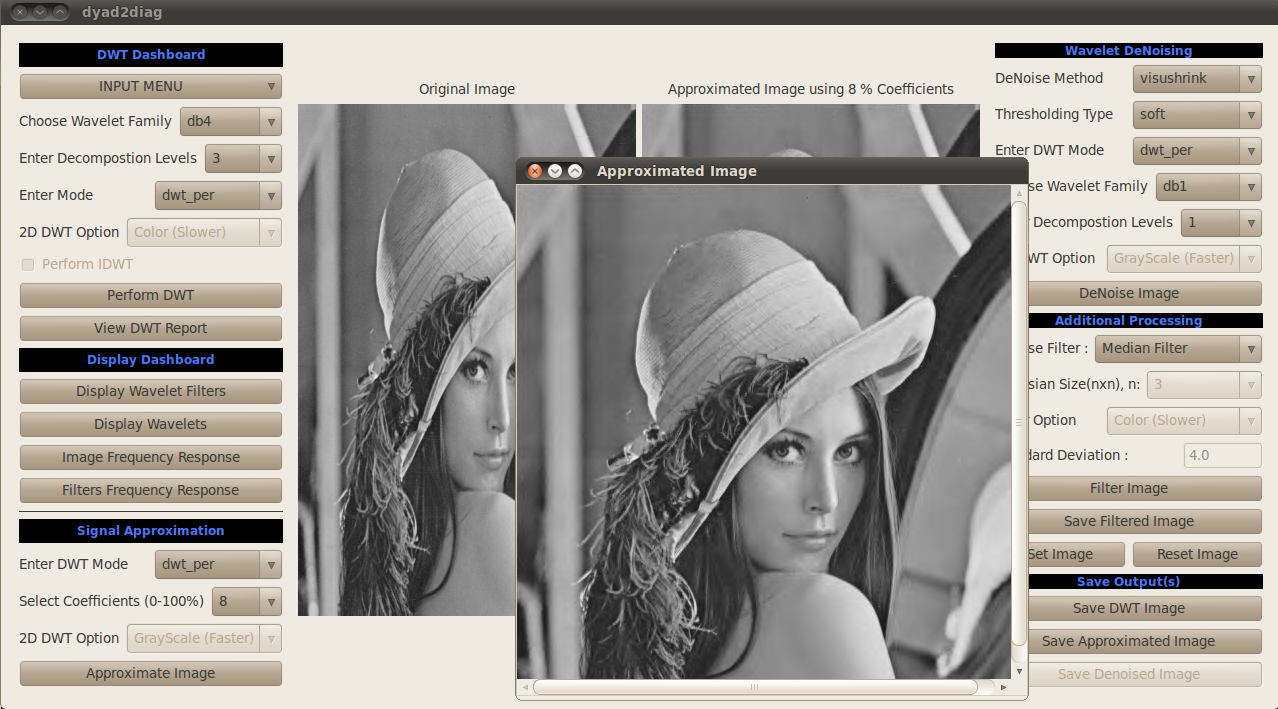
*- No compression algorithms are implemented. This is just a demonstration of wavelet approximation properties. However, you can access 1D approximation coefficients which may be helpful in implementation of compression algorithms.
4 Denoising
If DyadWaves’ denoising interface seems a bit intimidating, it is probably because it offers more choices than are necessary. Most available wavelets, decomposition level etc. won’t give you acceptable results most of the time. A few wavelets (symmlets - sym4 and sym8, Daubechies orthogonal wavelets) are the ones you should probably work with. This software is aimed mostly at students and beginners in this field so it makes sense to have as many options as possible. I have used 2 methods (visushrink and sureshrink) for 1D and three methods(visushrink, sureshrink and bayesshrink) for 2D.
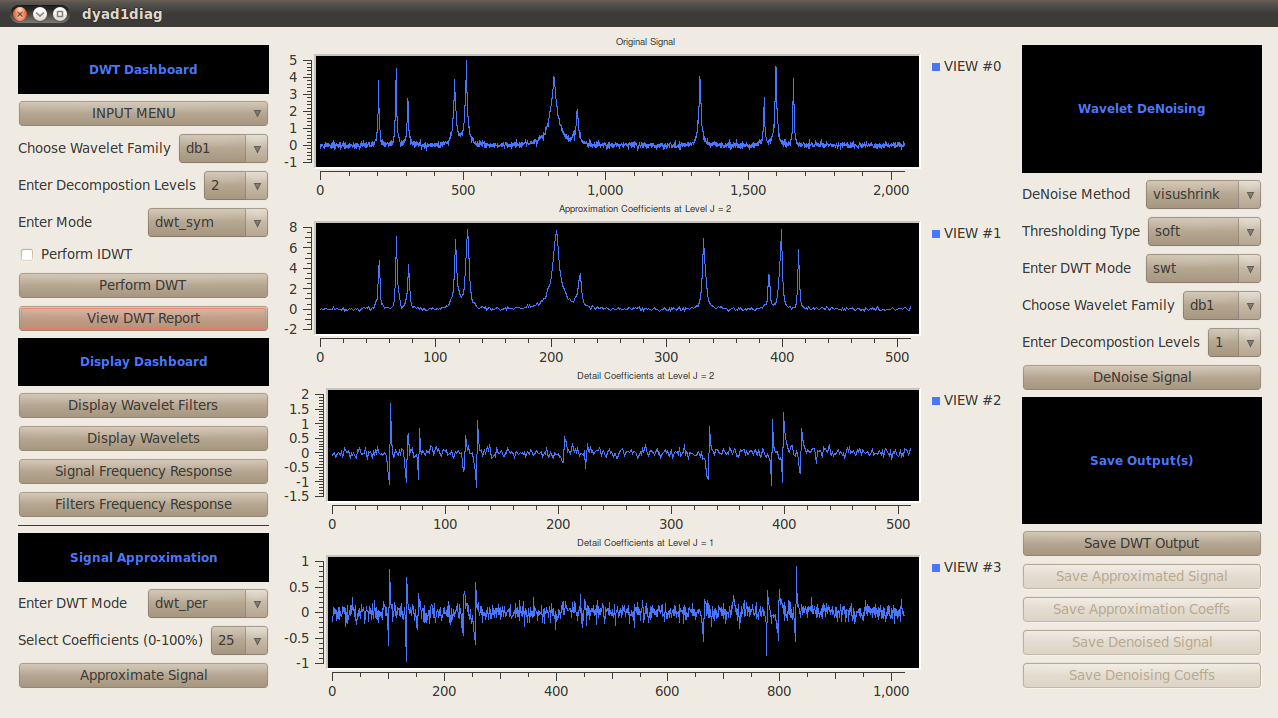
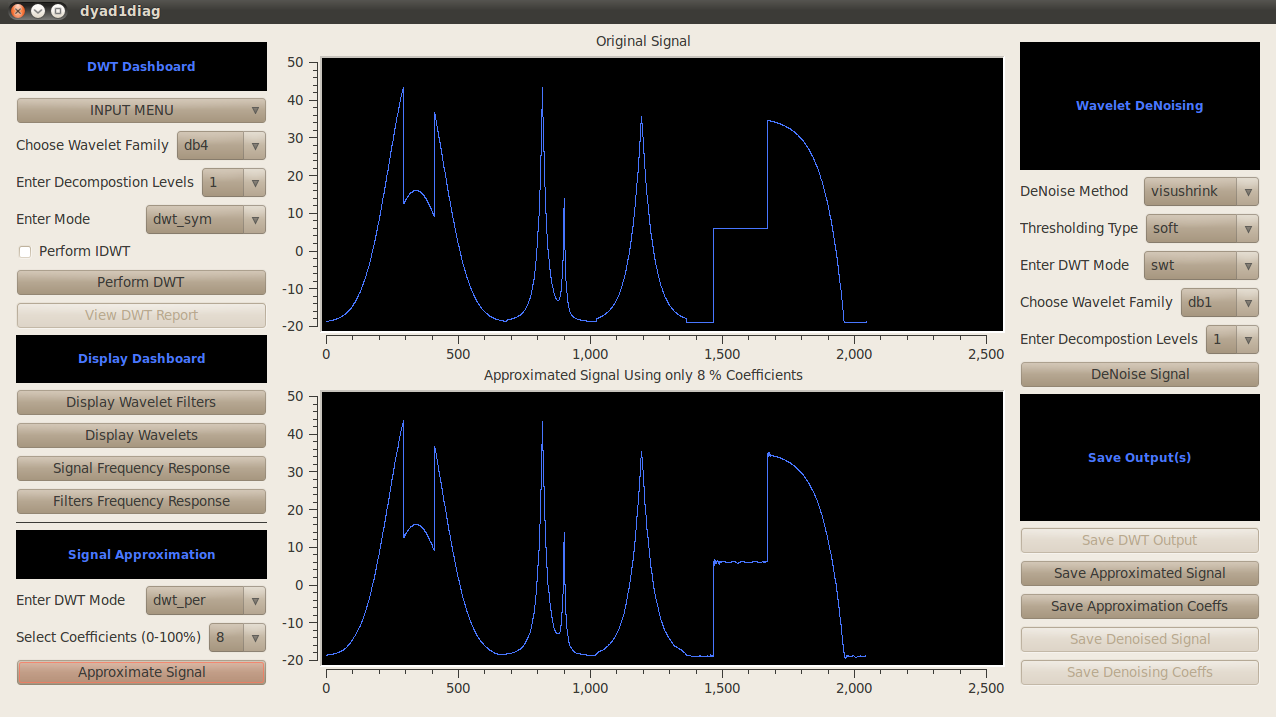
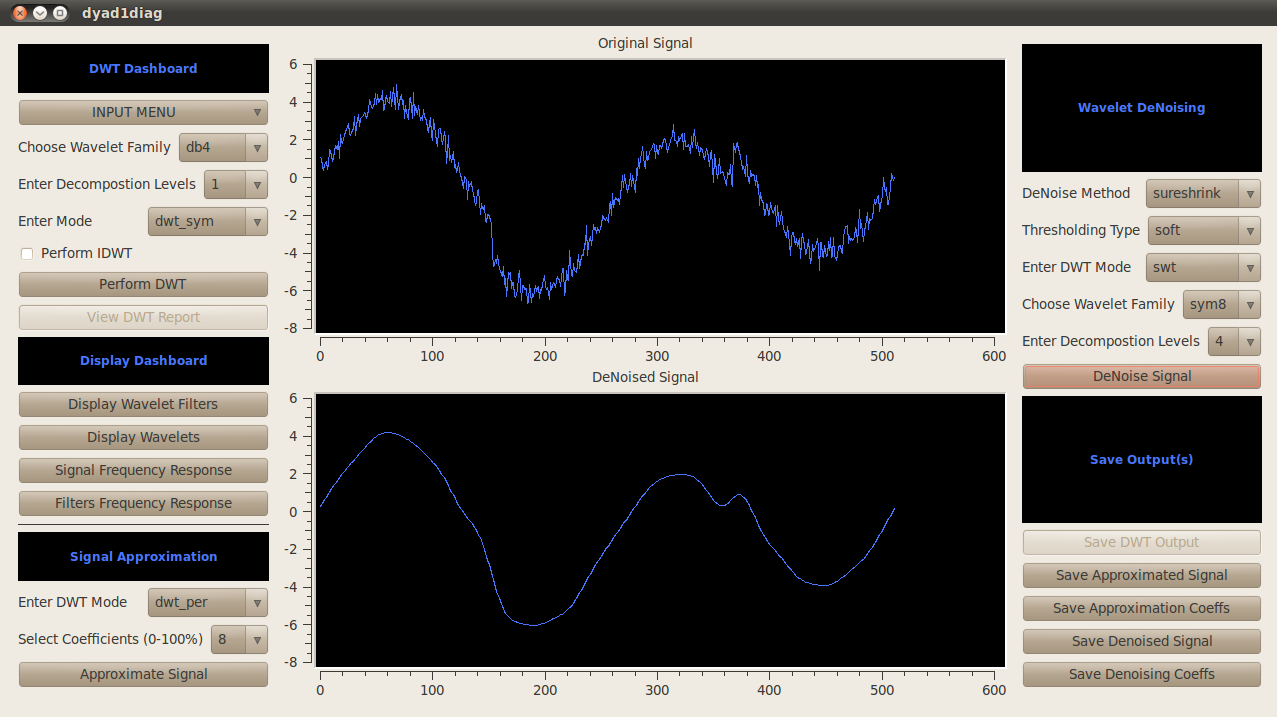
4.1 1D Denoising
Example below shows 1D sureshrink Denoising of Wavelab Heavisine signal( SNR 8dB) using sym8 wavelet with SWT 4-level Decomposition
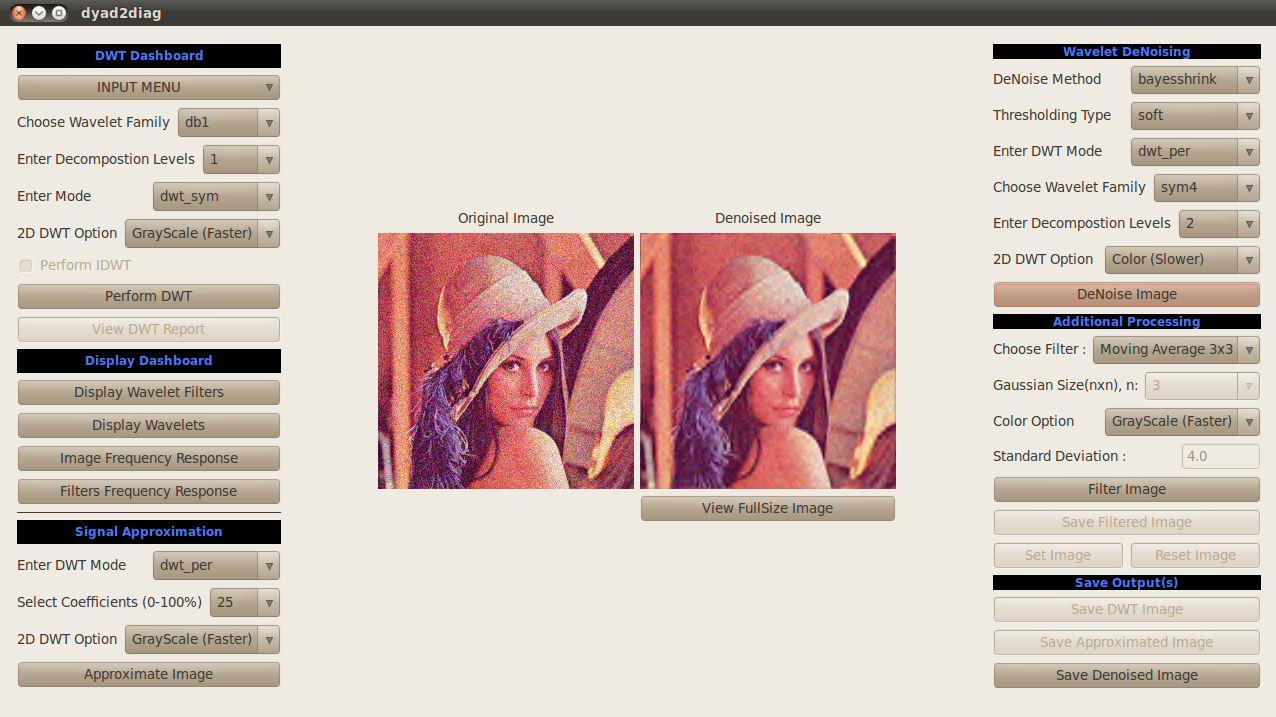
4.2 2D Denoising
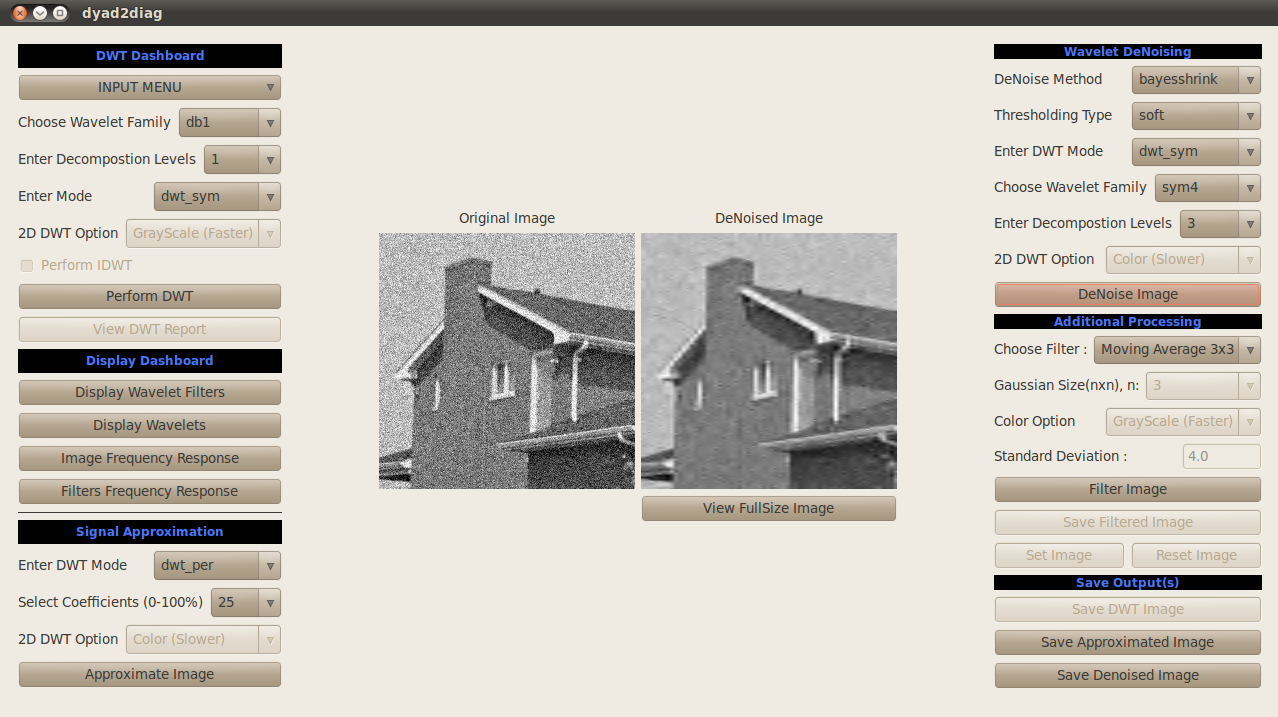
The two examples show 2D bayesshrink Denoising of Lena 256X256 Image( SNR ~ 20 dB) using sym4 wavelet with dwt_per 2 Level Decomposition and
2D bayesshrink Denoising of House 256X256 Image( SNR ~ 20 dB) using sym4 wavelet with dwt_sym 3 Level Decomposition.
5 Issues, FAQs and Contact
DyadWaves version 0.2.0.1
Documentation: http://code.google.com/p/dyadwaves/wiki/Overview and http://dyadwaves.sourceforge.net
License : GNU GPL
Source Code: See src folder of the download. Latest code will be available at http://code.google.com/p/dyadwaves/source/browse/#svn
Notes on Linux Installation : This version also contains a Linux tarball (dyadwaves.tar.gz). All the images shown above are screenshots of dyadwaves running in Ubuntu 10.04LTS.
I have also tested the tarball on Ubuntu 7.10. Please read the README file in dyadwaves.tar.gz.
This Wavelet GUI for windows/unix systems is practically in alpha testing stage and it has some stability issues. There is also the matter of its speed not being upto the par and this will require some code rewrite from the scratch. In the meantime you may want to work in the grayscale mode for images larger than 512 X 512. I’ve added "View DWT Report" button which will return the DWT computation time so you can plan accordingly. "View DWT Report" will NOT return accurate number of coefficients in 1D dwt_sym case. If you come across any errors or you have any suggestions, complaints and/or advice I can be reached at
rafat.hsn -at- gmail.com
Copyright (C) Rafat Hussain, 2011 Documentation